How design optimization enhances electric vehicle traction motor performance
Written by Federico Carlini
11 December 2024 · 10 min read
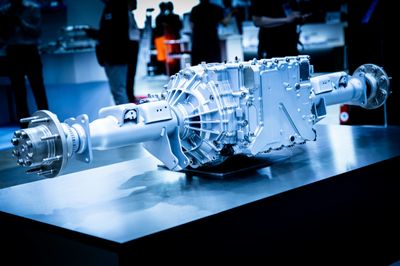
From 2021 to 2030, McKinsey predicts that the demand for battery electric vehicles (BEVs) will increase sixfold, with annual sales reaching roughly 40.0 million units, up from 6.5 million today. Electric motors, alongside batteries and power electronics, are critical components of the drivetrain. They directly impact efficiency, range, and the overall driving experience. Higher efficiency means less energy loss during motor operation, resulting in longer battery life and extended driving range. Increased output power improves acceleration performance and ensures the motor can handle various driving conditions. Minimizing vibration and noise levels in an electric vehicle (EV) traction motor is essential for a smooth and comfortable driving experience. Additionally, compact traction motor designs help maximize interior space and reduce vehicle weight, further enhancing efficiency. In this context, simulation technologies like electromagnetic analysis and design optimization are crucial for improving the performance of electric vehicle traction motors. These tools enable engineers to model and analyze the complex interactions within the motor, optimizing its design for maximum efficiency, power, and smoothness.
Combining electromagnetic simulation analysis and parametric design optimization
Coupling JMAG electromagnetic analysis into the modeFRONTIER workflow is a powerful simulation-driven approach for optimizing EV traction motor designs. JMAG is a comprehensive electromagnetic field simulation software specifically designed for electrical machine designs. It provides a wide range of features such as magnetic field, thermal, and structural analysis to identify potential design improvements. Meanwhile, modeFRONTIER is a process automation and design optimization software that enables you to automate JMAG’s electromagnetic analysis within a simulation workflow. It enables multi-objective optimization by considering multiple performance criteria simultaneously. modeFRONTIER orchestrates the simulation process, managing the data exchange between JMAG and other software. Engineers can define design parameters, objectives and constraints, then leverage design exploration and optimization algorithms to systematically explore the design space and reach optimal design solutions.
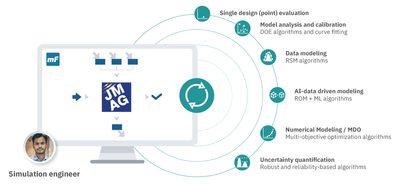
EVs traction motor design optimization process
1. Setting up permanent magnet motor simulation analysis and automating it in the modeFRONTIER workflow
Permanent magnet motors are known for their efficiency, compact size, and reliability. In this study, we aimed to optimize the performances of an 8 pole permanent magnet motor considering a high number of constraints and two different operating conditions: one at a low rotation speed [1200rpm] and another at high rotation speed [9000rpm].
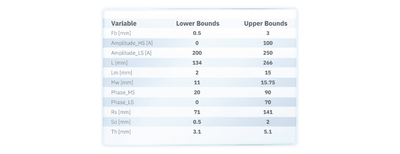
The study has 11 free parameters, which serve as the inputs of the optimization:
- Geometrical parameters [Fb, L, Lm, Mw, Rs, So, Th] defining the stator and rotor geometry
- Current specifications for both the operating conditions [Amplitude, Phase]

Electric traction motor geometry and variable dimensions
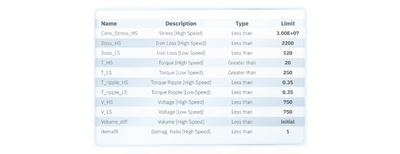
Permanent magnet motor optimization requires addressing performance targets and structural limitations, all of which are considered as constraints or objectives in our study.
List of constraints
In this use case, JMAG's traction motor electromagnetic analysis involved four sequential studies managed by the Analysis Group, which controls the geometry and the parameters for each step:
- Magnetic Analysis: simulates the magnetic field distribution within the motor, providing magnetic flux and distribution. This analysis assesses motor performance and predicts losses that impact overall efficiency.
- Demagnetization Analysis: assesses the risk of permanent magnet demagnetization under various operating conditions, such as high temperatures or overcurrent conditions.
- Structural Analysis: evaluates the mechanical integrity and performance of the motor’s structural components. This analysis considers factors such as mechanical stress, deformation under various operating conditions, including electromagnetic forces generated during motor operation.
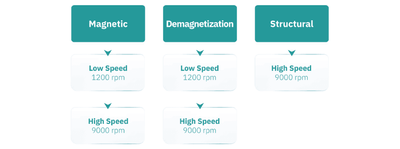
Next, we integrated and automated JMAG’s electromagnetic analysis within the modeFRONTIER workflow which configures and manages the input and output variables, and objectives and constraints to perform design exploration and optimization studies.
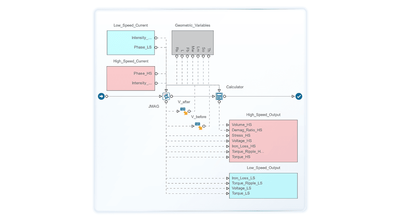
Design process automation with modeFRONTIER workflow
2. Performing design of experiments
The study starts with a design of experiments (DOE) to explore the design space. This allowed us to better understand key aspects of the optimization problem, such as variable parameterization, input/output correlations and constraints analysis. In this study, we generated 300 designs with the uniform latin hypercube (ULH) algorithm.
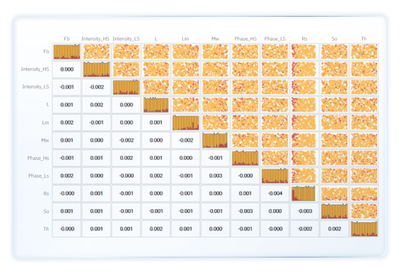
modeFRONTIER’s scatter matrix chart for DOE analysis
The scatter matrix chart revealed a low correlation between input variables, indicating that the DOE dataset was well-defined and uniformly covered the input parameter space. However, none of the 300 designs met the defined constraints, specifically stress and torque values at low speed. This presented a key challenge for the design optimization task.

Broken constraints analysis
The complexity of the optimization problem arises from the number of variables, constraints and objectives. To address this, sensitivity analysis was explored as a method to reduce the problem’s dimensionality. The analysis, conducted on the original parameterization, shows that all the input variables significantly impact the system’s response.
3. Applying different design optimization techniques
We used the DOE results as an initial population to perform a comparative analysis of multi-objective design optimization strategies to maximize the torque (at both high and low speed) and minimize iron loss (at high speed). To achieve this, we leveraged modeFRONTIER's proprietary algorithm, pilOPT. This multi-strategy, self-adapting algorithm combines the strengths of local and global search methods, intelligently balancing real and RSM-based optimization to efficiently search for the Pareto front.

With the one-step optimization approach, we already achieved promising results. This approach computed 1,300 designs and found 347 feasible designs and a Pareto frontier with 220 designs.
The multi-step optimization approach aims to identify the feasible region through a preliminary optimization step, then add more designs to this region, and finally, initialize a final optimization step using all the gathered information. The multi-step optimization consists of three steps:
- Preliminary optimization
- DOE on principal component
- Refinement [3 different approaches]
The preliminary optimization consisted of 300 iterations using the pilOPT algorithm. Although the number of iterations was lower than the first approach, the algorithm found 94 feasible designs which were sufficient to describe the feasible region. To accurately add designs within this region, we needed a parameterization that represents this complex hyperspace. This is why we used modeFRONTIER’s principal component Analysis tool.
Principal component analysis (PCA) is a statistical technique that reduces the dimensionality of data while preserving its essential structure. It identifies uncorrelated directions of maximum variance in a dataset, known as principal components (PCs), which capture the most significant information. This transformation enables a more efficient representation of the dataset while retaining its essential characteristics.
PCA is particularly useful in highly constrained optimization for two reasons:
- Dimensionality reduction: in optimization problems with many variables, PCA helps reduce dimensionality by identifying the most important components that explain the variance. Focusing on these principal components simplifies the optimization problem, making it more computationally manageable.
- Constraint handling: PCA also helps in handling constraints. For example, linear constraints in the original variable space can be transformed into principal component space, potentially simplifying their representation and manipulation.
In this use case, we performed the PCA analysis on the input variables, using the 94 feasible designs obtained in the first optimization step. Although the number of principal components matched the number of input variables, the first seven components captured 95.4% of the variance. The chart below shows the PCs sorted by the explained variance, with each PC defined by a lower and upper bound that represents the feasible region in the PC hyperspace.

Principal component explained variance bar chart
One approach is to reduce the complexity of the problem by reducing the number of variables. This offers two key benefits:
- Reducing the complexity of the optimization problem
- Minimizing noise caused by non-significant variables
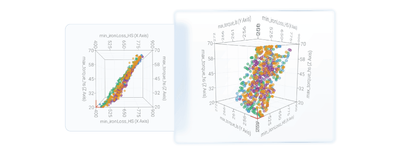
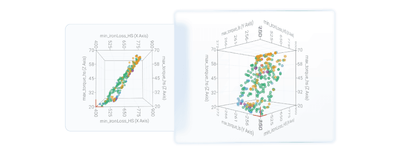
In this use case, we considered all the PCs because we aimed to focus on reparameterizing the problem rather than solely benefitting from dimensionality reduction. By maintaining the same dimensionality and problem complexity, reparameterizing the input variables using the PCA analysis simplifies the feasible hyperspace, allowing us to focus more effectively on the feasible region. It’s important to note that this approach assumes that the 94 designs are sufficient to describe the feasible region. This assumption is a key constraint which is subjectively defined. Naturally, the more feasible designs we consider, the more accurately the PCA analysis will represent the feasible zone. The two 3D scatter charts illustrate the effectiveness of reparameterization: the left chart shows that the reparameterized designs are very close to the 94 feasible designs from the preliminary step. In contrast, when using the original parameterization (right chart), adding the same number of designs doesn’t result in proximity to the feasible region.
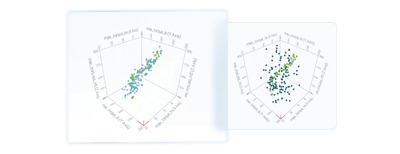
Left: DOE [ULH] of 113 designs on PCA parameterization; Right: DOE [ULH] of 113 designs on original parameterization.
After the preliminary optimization and reparameterization with PCA analysis, we refined our design optimization methodology with three additional approaches:
- Original variables and boundaries (Multi_1)
- Original variables and restricted boundaries (Multi_2)
- Principal components variables (Multi_3)
The maximum number of iterations was set to 587, totaling 1,300 designs computed across all strategies.
Multi_1: this approach uses the original parameterization and bounds. The algorithm starts with 713 designs:
- 300 from the DOE study
- 300 from the first optimization step
- 113 from the PCA reparameterization DOE
This approach found 347 feasible designs and a Pareto front of 122 designs.
Multi_2: this approach applies the original variables but restricts them to the feasible region boundaries found in the first optimization step. The optimization algorithm starts with 202 designs filtered to respect these bounds. This approach identified 443 feasible designs and a Pareto front of 187 designs.
Multi_3: for this approach, the modeFRONTIER workflow was modified to use the PCs variables instead of the original parameterization. It was initialized with 207 designs:
- 94 feasible designs from the preliminary step
- 113 designs from the PCA reparameterization DOE
This approach found 444 feasible designs and a Pareto frontier of 203 designs.
4. Comparing strategies
This work presents several approaches to highly constrained optimization problems without selecting one as the best. In this last chapter, we compare the results from different perspectives, incorporating a robust analysis of the results. To compare the results of the four approaches, we compiled the best designs from each optimization strategy into a comparison table.

Av in the objectives space that compares the 4 approaches results
The Multi_2 approach appears to provide designs with the best performance. When we extracted the non-dominated designs from the comparison table, we found that the Pareto front consisted mostly of designs from Multi_2.
3D Scatter Chart in the objective space that shows non-dominated designs
The best designs are distributed as follows:

Although the Multi_3 strategy yields the highest number of feasible designs, the approach that produces the majority of the best designs is Multi_2.
5. Robust analysis
The robust analysis aims to explore how the responses vary when there are uncertainties in the input parameters. In this study, it provides another way to compare the four optimization strategies considered. We set up the analysis by 5 designs from the Pareto front of each optimization strategy, representing a potential trade-off defining based on common criteria.
Filtering rules:
- Torque Low Speed > 260 Nm
- Torque High Speed > 40 Nm
For each set of five designs, we selected the best trade-off that minimizes both the stress and iron loss. Four input parameters were considered stochastic variables: Fb, Lm, Mw, Th.
Around each one of the five selected designs, 50 additional designs were sampled, distributed around the design using a normal distribution with standard deviation of 0.05 for each variable. This resulted in a total of 250 sampled designs per set. We then redefined the constraint functions using the percentile of the output values as follows.

For instance, the 99th percentile for a given output guarantees that there is a 99% probability that the design with that set of nominal inputs, with the given uncertainties, once realized, will have an output value less than the percentile.
However, there are two key limitations to consider:
- The sample size is at the lower bound for performing a meaningful statistical analysis with four stochastic variables. As a result, for outputs with simpler trends, we will obtain acceptable results, but for others, they may not be as reliable.
- The ideal way to obtain a robust solution is to perform a robust optimization, where the objective functions are also expressed in terms of percentiles, and the algorithms will work with these redefined objective functions.
These limitations are acceptable for our purposes, as this use case focuses on a qualitative comparison of different strategies, approaches and tools rather than a quantitative analysis. The results again show that the Multi_2 approach provides the highest number of feasible designs among the five selected, indicating that it offers the more robust solution.
While the results show that Multi_2 overall provides the best solution, there are several limitations to this study, and we can’t definitively declare it the best approach in all cases. The results we aimed to obtain are more focused on the methodology. We showed that:
- A multi-step optimization approach can be a valuable strategy for tackling a highly constrained optimization problem.
- PCA reparameterization is a powerful tool for handling highly constrained problems, allowing users to focus on an identified feasible region.
- Robust analysis can be used to assess the robustness of the obtained solutions, serving as an instrument to compare solutions from different approaches or to select the more robust design from a set of best designs.
modeFRONTIER is the leading software solution for simulation process automation and design optimization.
Design better products faster
modeFRONTIER is the leading software solution for simulation process automation and design optimization.
Design better products faster
modeFRONTIER is the leading software solution for simulation process automation and design optimization.


